 ;
;

The Bureau of Transport Statistics (BTS), a division of Transport for NSW, approached Arup to create an interactive platform for users to engage with their data. Produced in collaboration with OOM Creative, the Data Visualisation Project has increased the accessibility and navigability of transport statistics.
The BTS recognised that information access needs for their users was changing and empowered Arup to find a solution. Using modern web technology, including HTML5, the team created rich interactive environments that presented the information in simple forms. Despite the potential difficulties of the medium, such as incompatibility with older internet browsers, the BTS understood the opportunity and embraced it.
Each tool is comprised of transport, demographic and vocational information and examines an individual feature of Sydney’s travel tendencies. Datasets are modelled and forecast by the BTS Strategic Transport Model, addressing the methods, reasons and frequencies of travel, and projected changes over time.
Bespoke visualisations were created to communicate each set of information, and their differing spatial aspects.


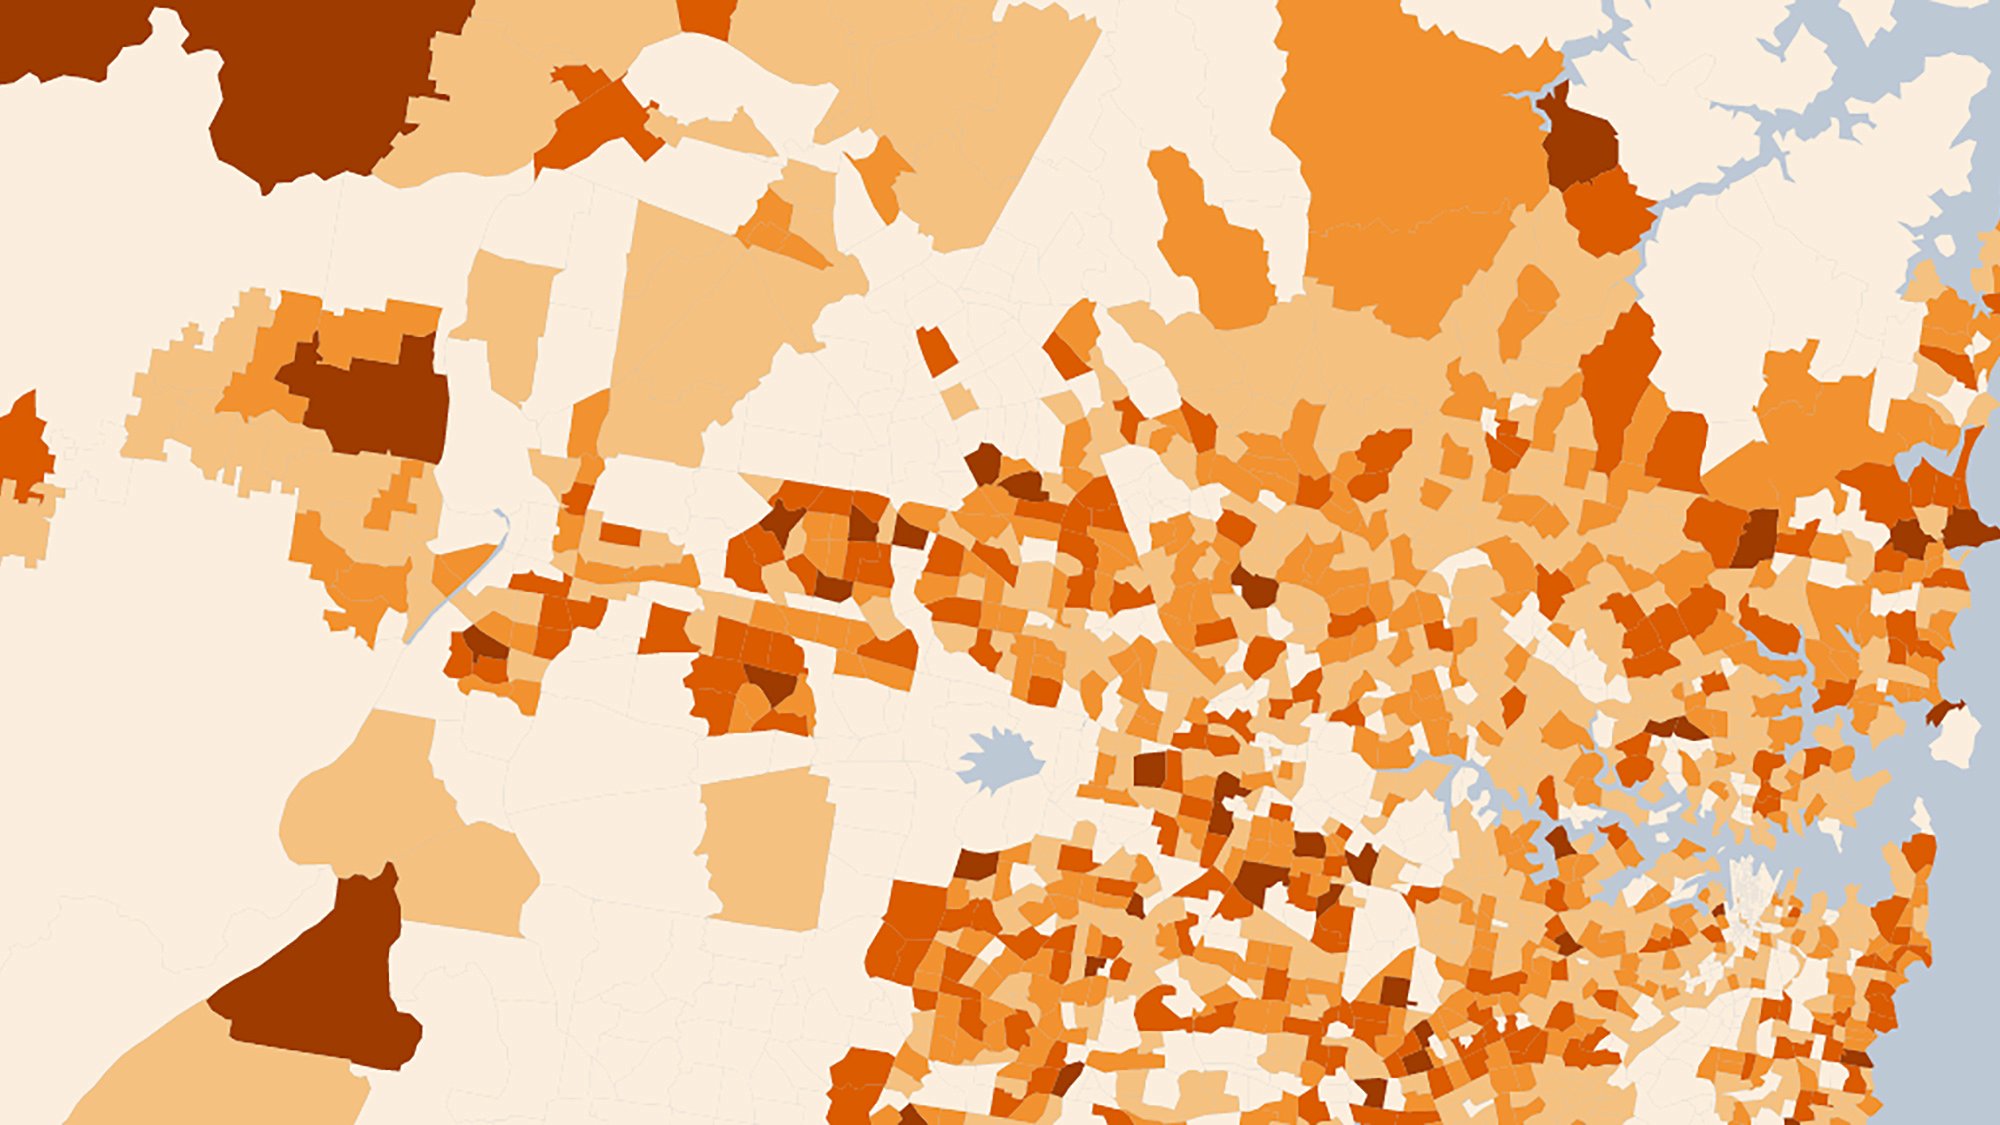
The Journey to Work Visualiser is one example of this. It displays the volume and mode of people travelling to work across the state through the use of a scalable sphere. The Landuse Planner uses a more conventional map, but quick view changes allow comparisons of the range of statistics plotted over it. It shows current and projected figures for population, employment and workforce by municipality, before allowing further segmentation by demography.
The project has received widespread acclaim from transport planning and web technology communities across the world. While much of this has centred on the innovative approach, the project has also increased efficiencies in the BTS’ methods. The Landuse Planner alone has removed the need for the manual production of over 400 maps annually.