 ;
;

In anticipation of a budget with unprecedented commitments to infrastructure, the NSW Government required a way to communicate ‘Budget Paper No. 4 – Infrastructure Statement’ to the public. Arup was approached for a way to help communities and stakeholders better understand the distribution and details of the individual projects.
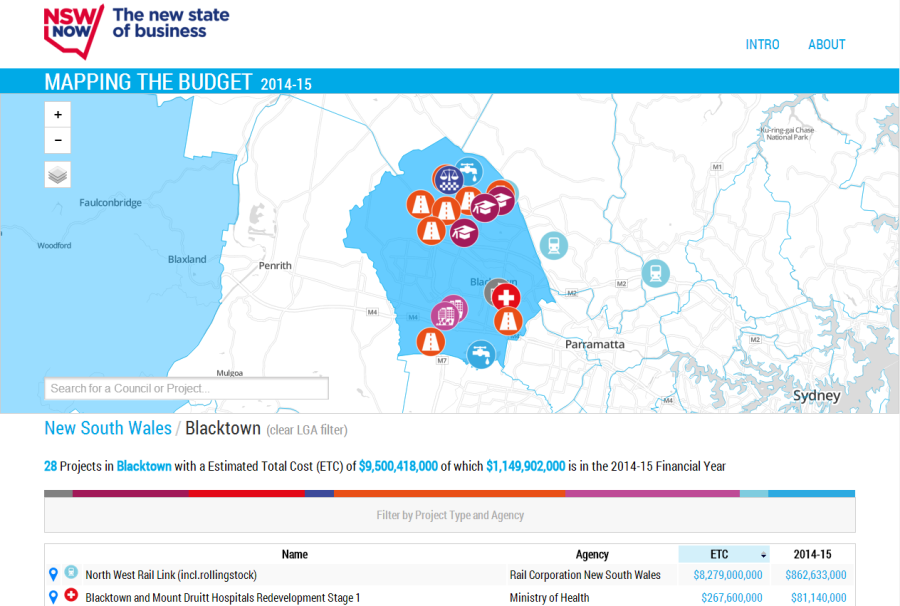
The result was ‘Mapping the Budget’, an interactive map that allows users to locate and explore infrastructure investment across the state and in their local area.
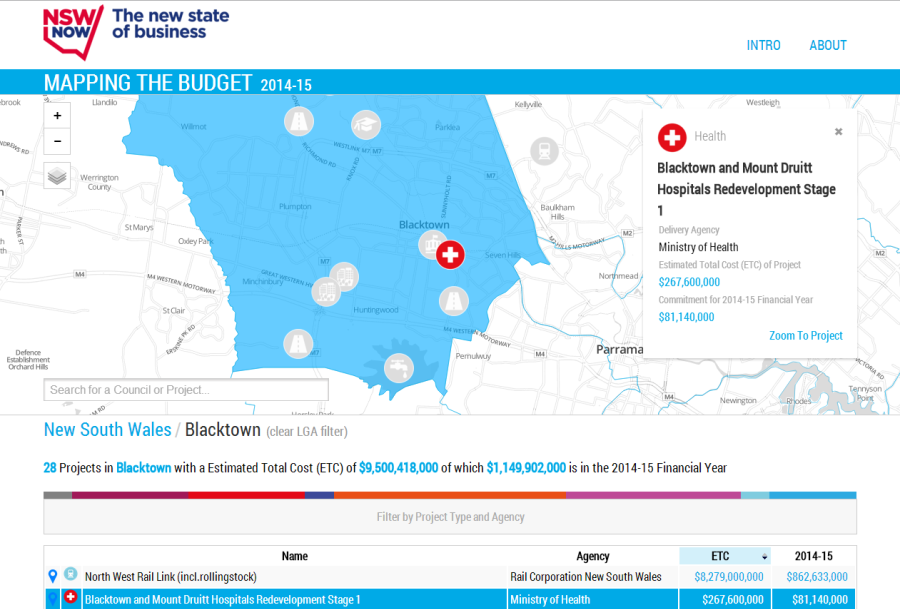
Within the visualisation, projects are split into various categories. Each individual project is pinned to the map, badged according to which category the works fall under, and can be searched, sorted and expanded for more detail. Once selected, project information includes a brief description of works, estimated total cost, and financial commitment for the 2014-15 financial year. They can also be filtered and navigated by clicking or searching the local government areas on the map.

Visualising data in this way makes it much more relatable for the general public who are increasingly looking to technology to access information while on the go. The visualisation has been designed to be accessible on a mobile phone and tablet as well as through modern desktop browsers.
The project was undertaken by the digital team in Sydney, who have delivered innovative digital services with the NSW Government on a range of other projects.