 ;
;
Transportation equity is a growing concern for cities across the United States. Access to affordable transportation affects people’s quality of life, as well as their economic opportunities. When transportation infrastructure or delivery is inequitable, it can contribute to other existing disparities.
How can municipalities improve transit services for the people who need them most?
To start, communities need to figure out how equitably they deliver services today. They also need comprehensive, objective insight into key populations, geographies, and local needs.
Arup developed the Equity Explorer tool and a framework to put all of this information within reach. Using the Equity Explorer, users can evaluate existing conditions related to transportation equity and explore opportunities for improvement. The tool currently relies on data available in the United States but could be replicated in other countries based on data availability. The web-based tool is quick and easy to use, and accounts for multiple equity parameters.
What is transport equity?
"A transportation system that provides safe, reliable, environmentally sustainable, accessible, and affordable transportation options to all, including low-income communities, communities of color, and other communities that have been disproportionately impacted by pollution and a lack of services.…Transportation equity is intrinsically linked to access to economic opportunities, and occurs when communities have the power to make decisions about their transportation systems."
– State of California Sustainable Transportation Equity Project
The Equity Explorer
Arup’s Equity Explorer provides a transparent and flexible way to investigate transportation equity in any region or jurisdiction within the United States. It uses publicly available data to identify vulnerable and historically underserved geographies. Cities, transit/planning agencies as well as developers or even large companies exploring new office locations can use the data to evaluate transportation performance on a variety of equity indicators, and they can create custom transportation vulnerability indices for planning purposes. For example, planners can identify areas with poor transit accessibility or high vehicle miles traveled.
The Equity Explorer includes more than 40 tables of demographics, transportation behavior, and other equity indicators. It can compare performance for the census tract, at the county level, or among geographies of opportunity.
Arup’s Equity Explorer was developed as an open-source platform available for free use. It serves as a basis for Arup’s equity work around the US supporting agencies and entities in their planning and decision making around transportation equity. Arup would be able to customize the tool and outputs for specific stakeholder needs.
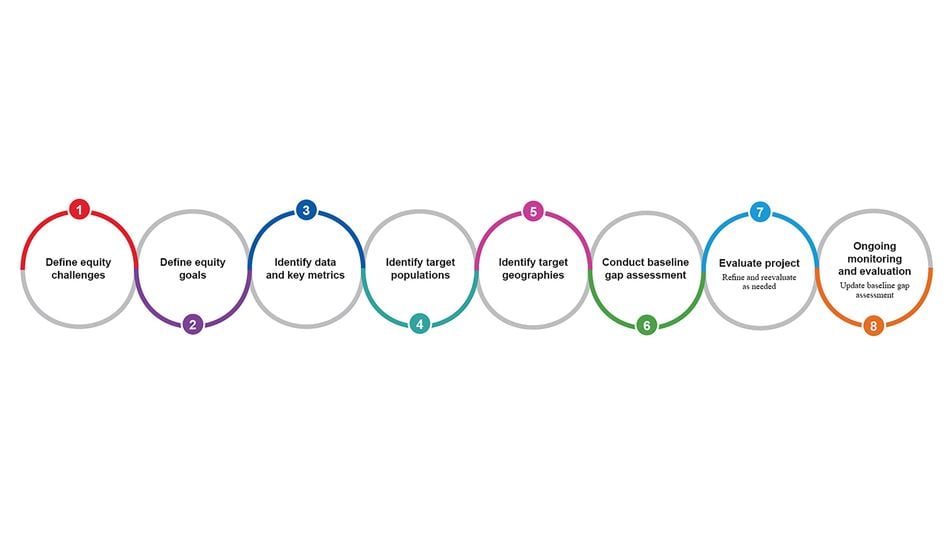
A framework for equity evaluations and strategy identification
Access to data is just one piece of the puzzle. Public agencies also need a reliable way to assess equity in their communities’ transportation services. That’s why Arup developed the Equity Evaluation Framework to guide public agencies through the evaluation process (Figure 1).
Our framework was informed by equity assessments we have performed across the Americas region and methods adopted elsewhere. The Equity Evaluation Framework provides communities with a consistent and replicable method. It leverages open-source data to support policy development, which increases transparency and public buy-in.
The eight-step framework is linked to the Equity Explorer tool, which can identify “Equity Geographies” in a county or region for which strategies need to be developed and implemented. Equity geographies are census tracts that have a significant concentration of underserved populations, such as households with low incomes or people of color. The tool is adopted to determine a baseline needs assessment to identify required strategies and evaluate potential projects. The tool does not replace community engagement but helps identify communities, needs and hence supports communications.
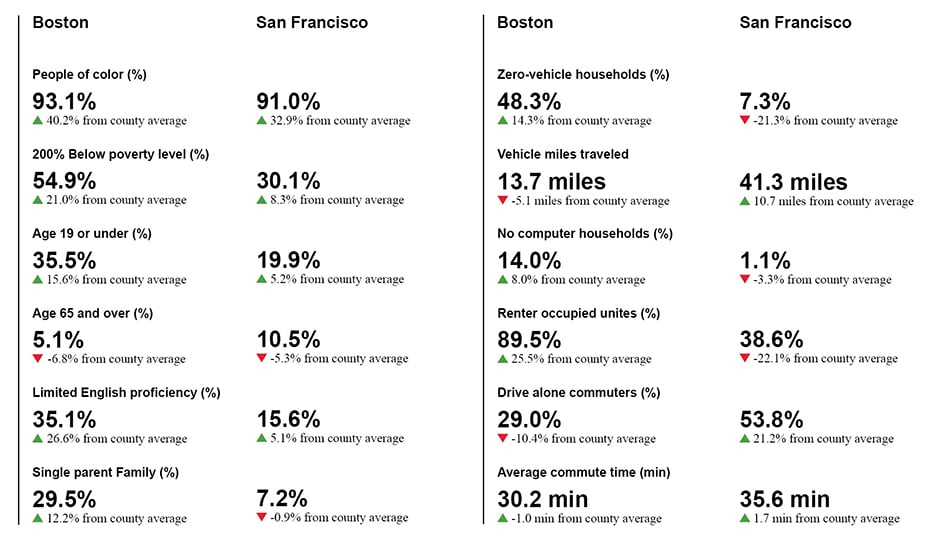
Applying equity tools in San Francisco and Boston
Arup used the Equity Explorer tool and evaluation framework to assess and compare transit equity in San Francisco and Boston. These cities were chosen for their unique histories surrounding transit, development, and redlining. Transportation infrastructure has been inequitably distributed in both cities and, in some cases, used to segregate and raze communities (e.g., through highway expansion). Our tools were able to identify equity challenges, target geographies for improvement, and conduct needs assessments.
San Francisco
San Francisco County is the fifth-most densely populated US county. San Francisco struggles to meet the transportation needs of a wide demographic range; redlining and unequal investments have contributed to longstanding inequities.
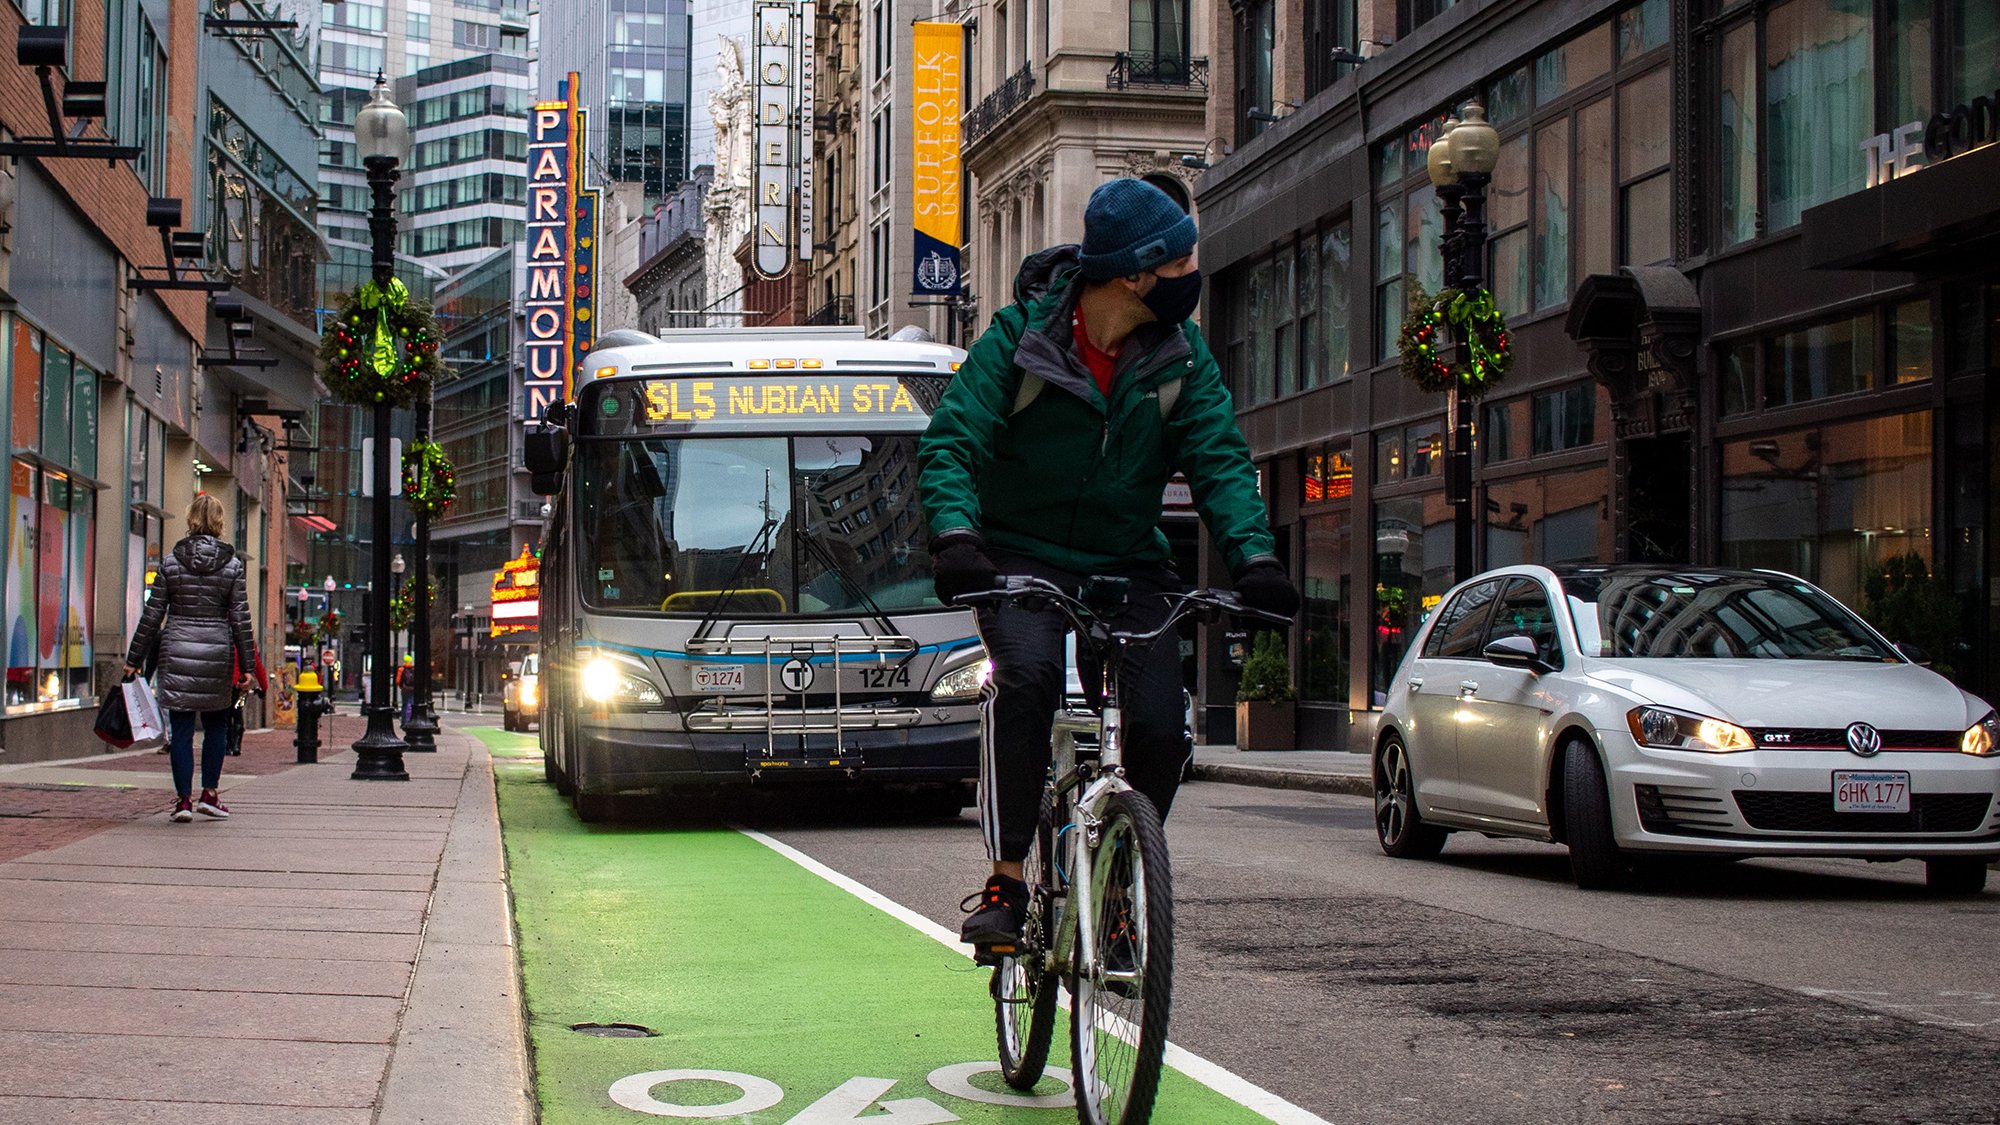
Boston
Boston is located in the seventh-most densely populated county in the United States, Suffolk County. While many areas have access to rapid transit, most citizens rely on buses.
Defining equity challenges, goals, and target geographies
The Equity Framework leads users through a data-driven investigation of key transportation metrics so they can pinpoint underperforming areas. With this insight, it becomes easier for communities to define equity goals and target geographies.
In San Francisco and Boston, we examined commute times and zero-vehicle households:
Commute time
We analyzed variations in commute times in each city as a way to measure accessibility. For our study, commute time was defined as the time it takes an individual to get to/from work.
In San Francisco, transit users in the downtown area have the shortest average commute times, presumably because residential areas are closer to office spaces. Transit users in the southeast part of San Francisco have longer commute times, as indicated by the darker color on the map (Figure 2). Their commutes may be affected by longer distances between their destinations, traffic, or quality of public transit service.
(Right) Figure 2: Commute time in San Francisco
Boston has similar patterns. Citizens that are closest to downtown have lower commute times than those who are further away from the city center (Figure 3).
(Left) Figure 3: Commute time in Boston (and Greater Suffolk County)
Zero-vehicle households
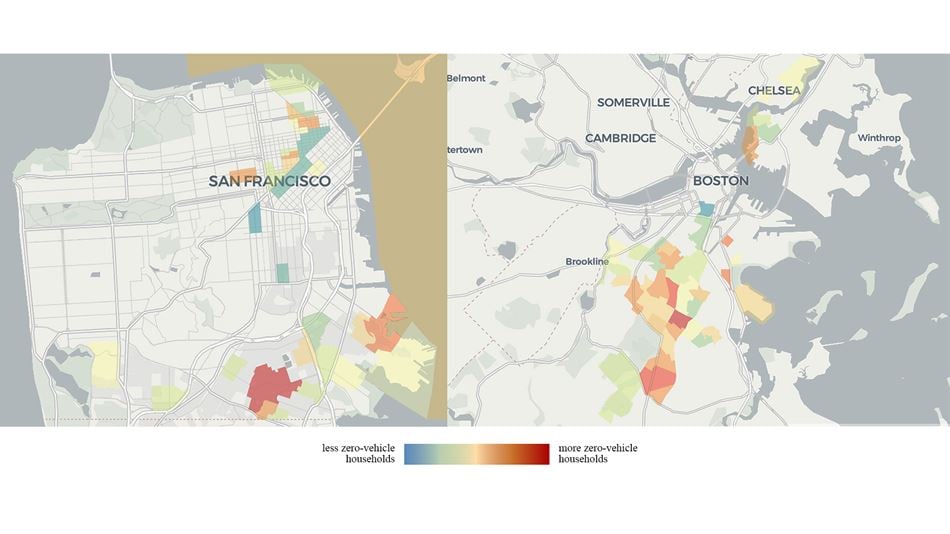
The Equity Explorer can map zero-vehicle households, which is one way to evaluate socioeconomics within the transportation context. The tool uses a spectrum of green to red to indicate the proportion of households without access to a vehicle.
In Boston, areas with longer commute times also have greater vehicle access (Figure 4). This reflects local behavior and is an indicator that a higher proportion of people drive. Depending on underlying demographics, such as income, it could also indicate that households cannot afford a vehicle.
(Right) Figure 4: Zero-vehicle households in Boston (and greater Suffolk County)
In San Francisco, the southeast area has longer commute times and more households without vehicles (Figure 5). Contrary to Boston, lengthy commute times in San Francisco may reflect lower access to cars and longer trips on public transit.
(Left) Figure 5: Zero-vehicle households in San Francisco
The Transportation Vulnerability Index
To help users identify geographies and compare opportunities for investment, the Equity Explorer includes a Transportation Vulnerability Index. Users can select and weigh metrics, then compare performance across different census tracts in their area (Figure 6).
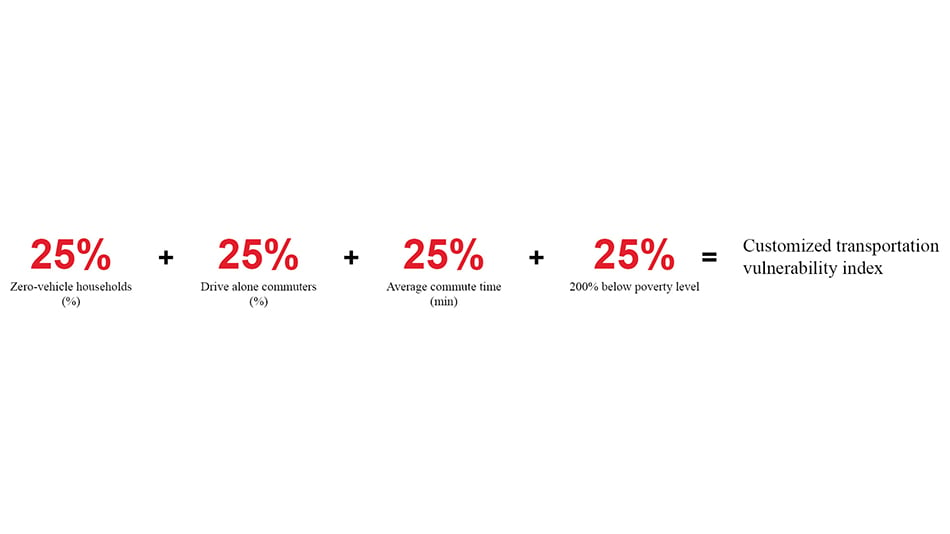
The index can be overlaid with information about the existing public transportation network, including stops and routes, to identify investments that would help address transportation equity.


The vulnerability indices for San Francisco and Boston offer compelling insight: More than half of census tracts in Boston scored 40+ on the Transportation Vulnerability Index, compared to about 20% in San Francisco. There are fewer zero-vehicle households in San Francisco and shorter average commute times.
Which projects will drive equity?
Spatially evaluating both cities shows transit planners which tracts have the greatest needs. In the census, those areas are revealed to have higher density of minority and low-income populations, demonstrating systemic disparities.
Addressing these disparities is key to improving transportation equity through projects. The Transportation Vulnerability Index can be customized to consider demand, behavior, and equity metrics, which all need to be accounted for as projects are planned and evaluated (Step 7 of the Equity Evaluation Framework). Maps reveal which census tracts have the highest values and therefore, the greatest transportation needs (Figure 9).
Opportunities for further analysis
Arup’s analysis using the Equity Explorer tool revealed disparities in both cities related to demographics, commute times, and transit access. The tool can drill down these statistics to the census-tract level, allowing for comparisons between vulnerable areas and their surrounding areas (Figure 10).
These analyses reinforce the importance of integrating transportation equity considerations and sets a foundation for more detailed and nuanced exploration at the neighborhood level.